Business Solutions
Power BI
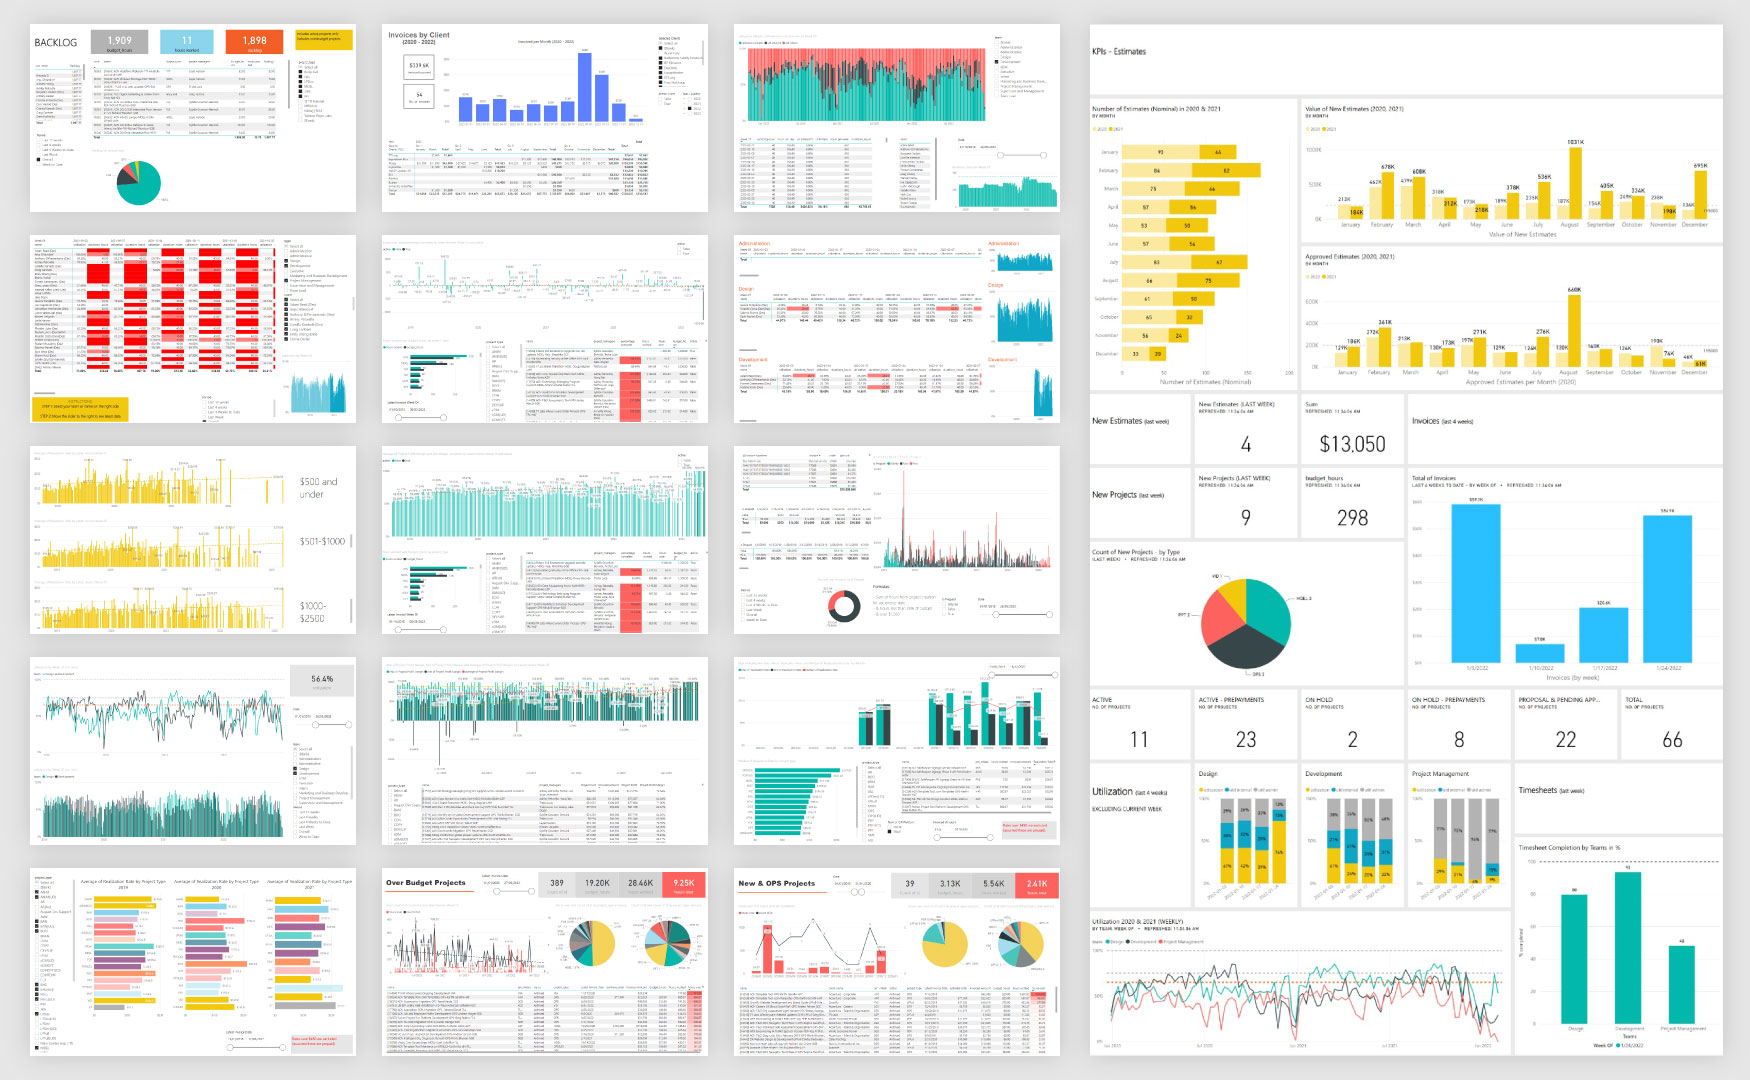
The Challenge: How to identify gaps in service quality and profitability, which service lines carry the highest margins, which types of project typically have issues, average size and what are the common themes. Which employees are over or under utilised, what clients are the most or least consistent with enquiries, which have highest conversion.
The Solution: Ingest tens of thousands of data points across multiple platforms, account and project management, timesheets and invoicing into Power Bi and generate a collection of dashboards that provide insights into gaps, project trends based on year-over-year, month-over-month data.
